Current Impact

Context AI, OpenEPA & Calculation Editor

Leading UX design strategy and design team operations for OpenEPA emissions data platform and specialized microservices that transform how energy companies and environmental researchers access, analyze, and trust industrial data—through user-centered design, data visualization excellence, and transparency-first UX patterns.

$85M Pipeline Enabled Through Design
95% User Efficiency Gain (Design-Led)
15+ Industrial UX Patterns Pioneered

Design Portfolio

Leading UX design for one enterprise platform and two cross-cutting microservices serving multiple domains: EPA emissions data for researchers, energy sector intelligence for AEs, and custom calculations for analysts. Design strategy spans user research, information architecture, data visualization, and interaction design for complex industrial data.
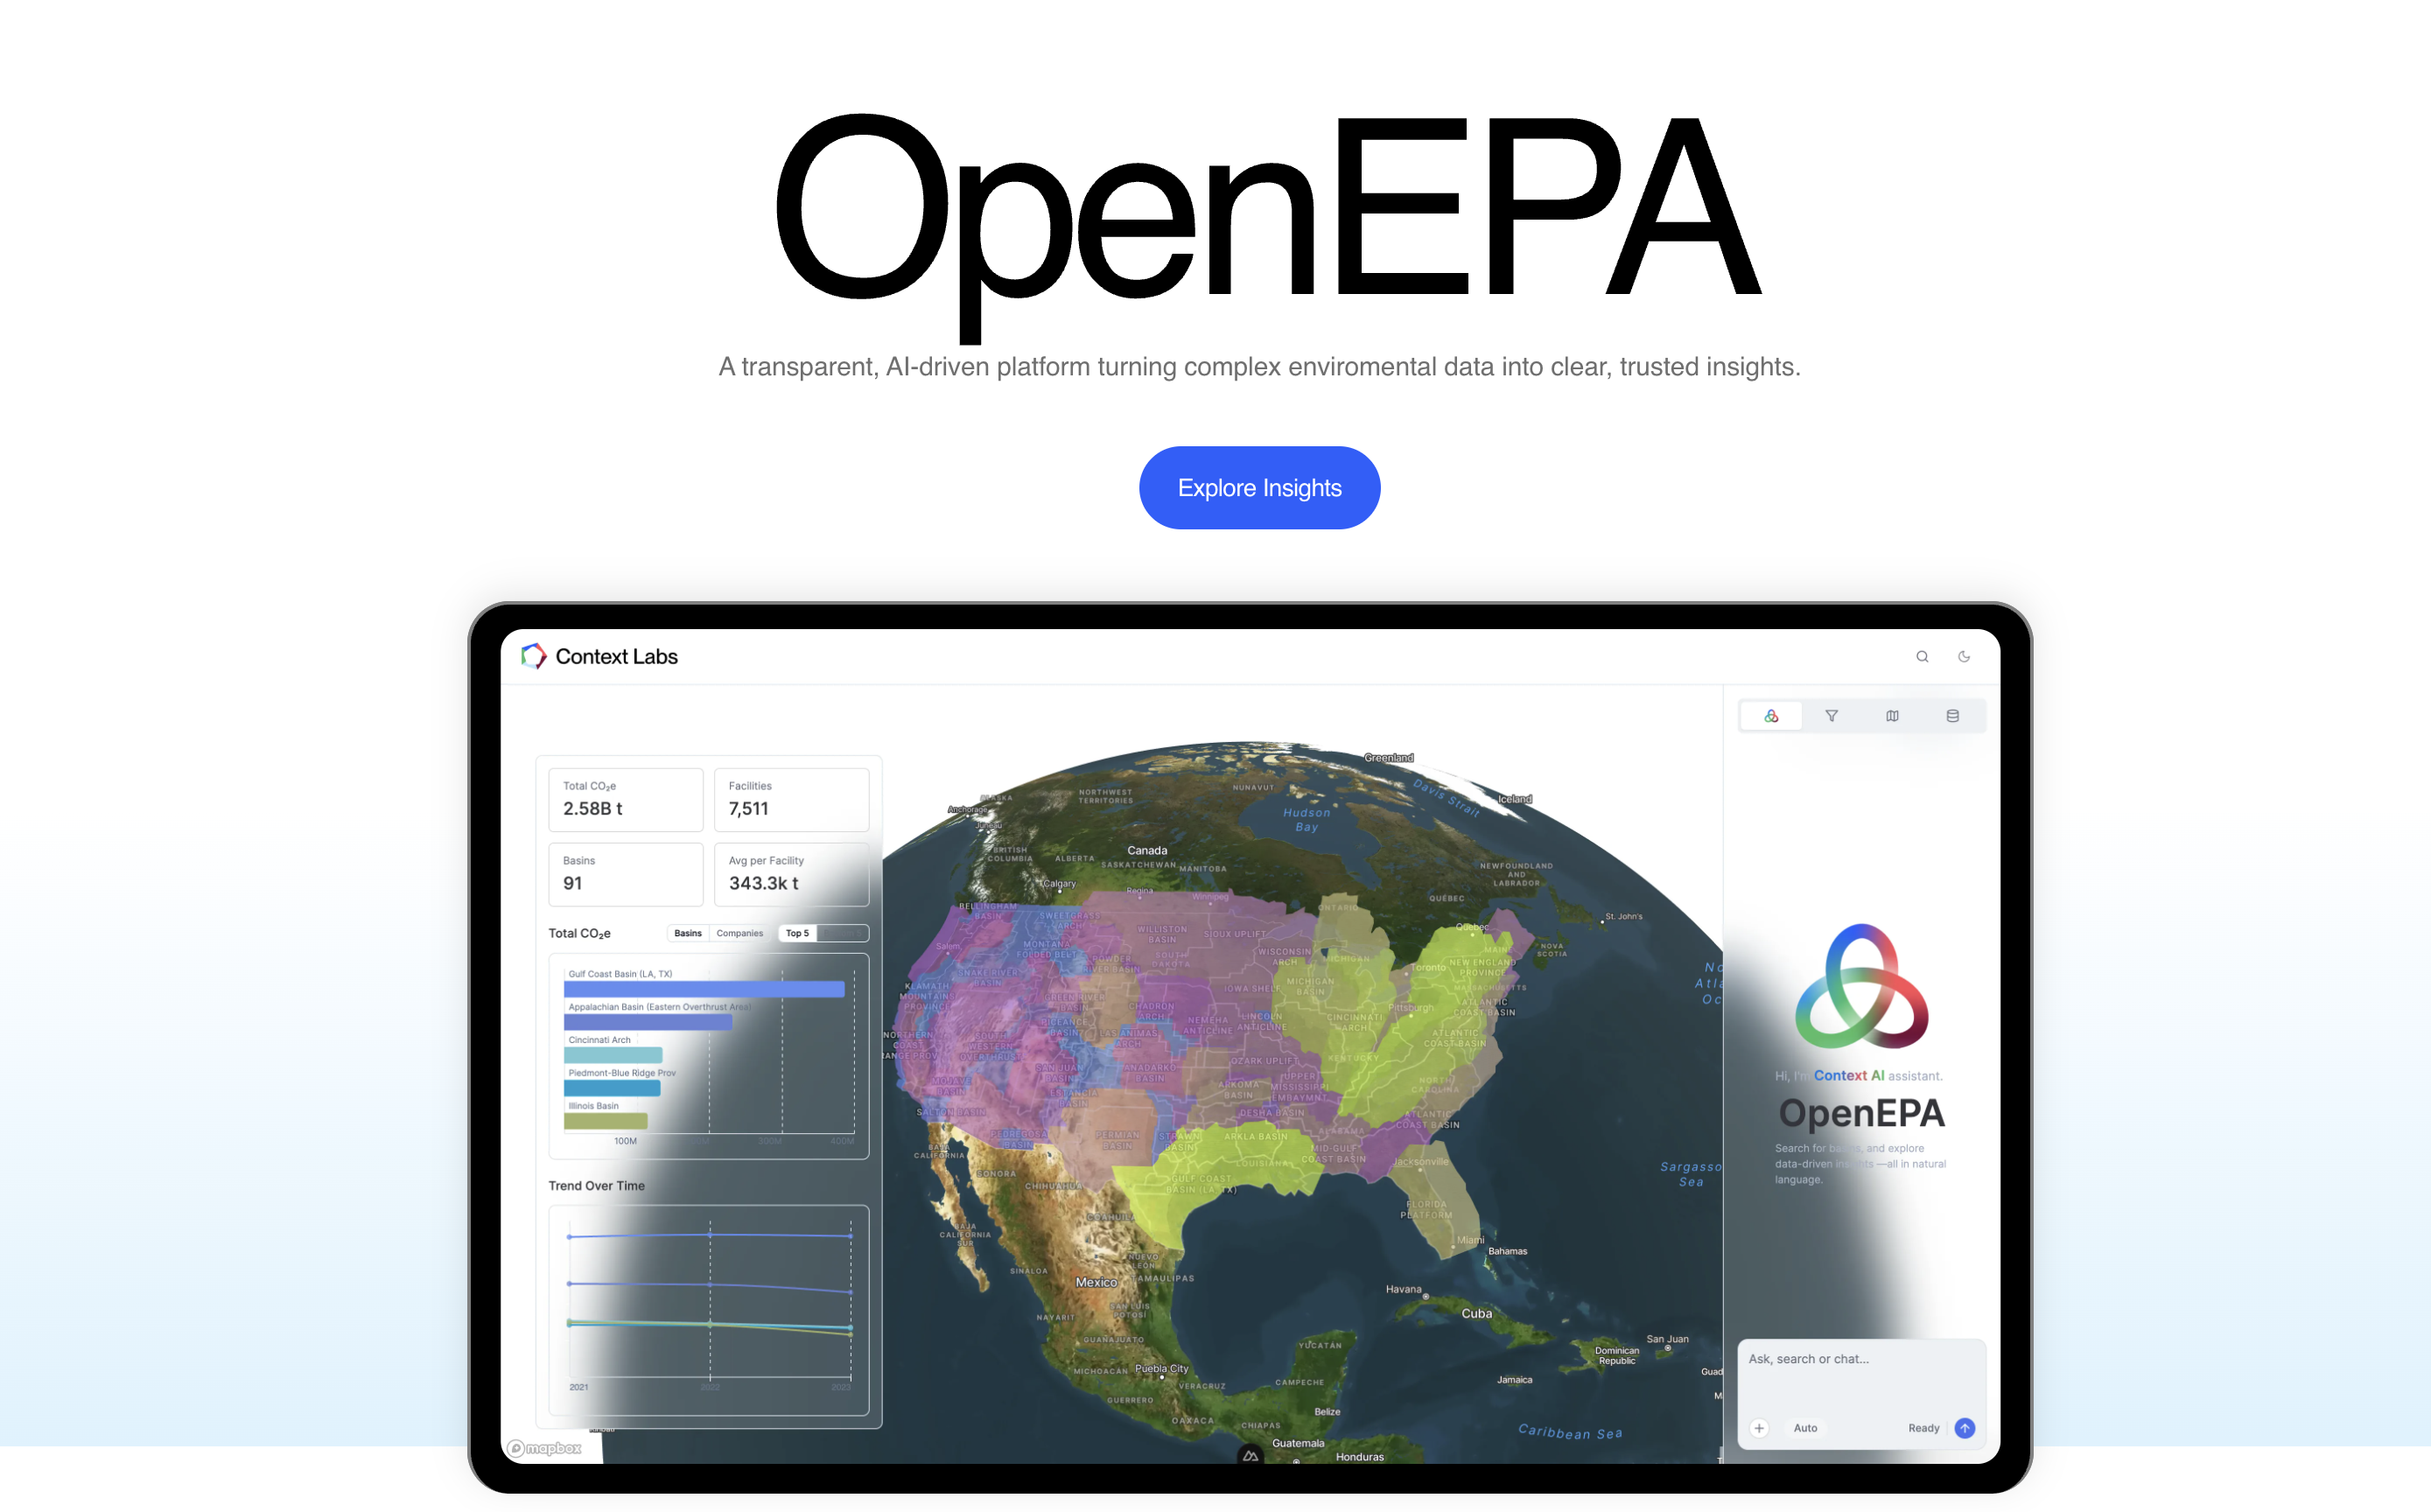
OpenEPA Platform

Pilot

Led UX research and information architecture for EPA emissions platform serving researchers and journalists. Designed data visualization for 15 years of history, citation/provenance UX patterns, and AI Q&A interfaces balancing natural language with data precision.

2,800+ facilities • 15 years data • 99.9% uptime

Context AI Microservice

Live

Directed UX design for AI-powered intelligence tool. Led user research with energy sector AEs, designed conversational UI patterns, and built production-ready design system using Vue 3 + TypeScript achieving 95% efficiency gain through user-centered workflow redesign.

2+ hours to 5 min prep • $85M pipeline • 200+ hrs/mo saved

Calculation Editor Microservice

In Development

Led interaction design for calculation transparency microservice. Pioneered UX patterns for industrial formula documentation, methodology disclosure, and audit trails meeting academic reproducibility requirements—establishing new design standards for trustworthy data analytics.

Academic-grade reproducibility • Cross-platform

User research personas and journey maps for energy sector AEs, environmental researchers, and journalists
Research & Journey Mapping

User Research Leadership

Led comprehensive user research program across three distinct personas (energy sector AEs, environmental researchers, journalists). Established research methodology combining shadowing sessions, workflow analysis, and journey mapping to uncover latent user needs and design opportunities driving product strategy and design decisions.

Stakeholder Interviews

15+

One-on-one interviews with AEs, researchers, journalists to understand current workflows, tools, and pain points. Recorded 2+ hours of manual prep time per client for AEs, black-box calculations for researchers.

Shadowing Sessions

8 users

Observed real workflows in action: AE client research across scattered sources, PhD researchers building emissions models in Excel with zero reproducibility, journalists unable to cite unattributed data.

Journey Mapping & Analysis

3 personas

Mapped end-to-end user journeys for each persona. Identified automation opportunities: AI-powered onboarding (95% time reduction), transparent calculations (academic reproducibility), data provenance (journalistic citations).

Building Story

Design Leadership Journey: From Enterprise Design Systems to Open Data UX Innovation

After establishing design systems for industrial digital twins in Immutably™, I identified an opportunity to apply user-centered design principles to EPA emissions data access. This sparked a new design direction: creating intuitive interfaces for complex environmental data through design research, rapid prototyping, and design validation with researchers and journalists.

Seeing the Opportunity in Open Data

Q1 2025 The Realization

After building Immutably™'s Knowledge Graph technology to create industrial digital twins, we had a powerful insight infrastructure. Energy clients were using it to model entire facilities, but the KG capabilities (ontology mapping, sub-second queries, data provenance) could do so much more.

We spotted the opportunity: EPA's GHGRP emissions data was public but difficult to use. Researchers spent weeks wrangling Excel files, journalists couldn't cite sources, and custom calculations had zero reproducibility. Our KG technology could solve all three problems at once.

Design Research: I led user research with environmental researchers, journalists, and sustainability analysts. The pain points were clear: 2+ hours of manual prep work per analysis, black-box calculations, and no way to verify results. This research informed our design strategy: create transparent, citation-first UX patterns for data access.

Design Prototyping & User Validation: Designing AI-Powered Data Exploration UX

Q2 2025 Rapid Prototyping

I led design prototyping for OpenEPA using rapid high-fidelity prototyping to validate conversational UI patterns for data queries. Conducted user testing with 15+ researchers validating design hypotheses: natural language queries with structured data responses, citation visibility, and progressive disclosure of complex emissions data. Design validation informed engineering architecture decisions and feature prioritization.

In parallel, I designed Context AI microservice UX for energy sector client intelligence. Using Vue 3 + TypeScript, I created production-ready design prototypes for AI-powered onboarding flows reducing prep time from 2+ hours to 60 seconds. Design prototyping with mock services unblocked parallel engineering development, saving 3 weeks per product cycle through validated design direction.

Design Impact: Context AI design generated $85M in attributed pipeline through improved AE workflow efficiency. OpenEPA design attracted 100+ early users from research institutions through user-centered data visualization and citation UX patterns.

Building OpenEPA: EPA Data at Scale

Q3 2025 Platform Infrastructure

With the POC validated, we built the full OpenEPA platform infrastructure. I designed the EPA data ingestion pipeline with version tracking where every emissions report is timestamped with its EPA source URL and release date. This wasn't just about loading data; it was about creating an audit trail that researchers and journalists could trust.

We integrated ArcadeDB as our Knowledge Graph store, leveraging the same ontology-mapping capabilities we'd built for Immutably™. The result: sub-second queries across 2,800+ facilities and 15 years of emissions history. Researchers could compare facility emissions trends, identify geospatial hotspots, and benchmark Top/Bottom 5 emitters, all with full data provenance showing exactly where each number came from.

Tech Stack: ArcadeDB for Knowledge Graph storage, custom ontology for emissions data modeling, EPA GHGRP API integration with delta sync, version-controlled data pipeline with rollback capabilities. Deployed on cloud infrastructure with 99.9% availability targets.

Deploying Context AI on Azure: Connecting Intelligence to Our Knowledge Graph

Q4 2025 AI Intelligence Layer

With the EPA data pipeline running, we deployed Context AI on Azure to power the intelligence layer. The challenge was connecting AI models to our Knowledge Graph so they could answer complex emissions queries with full citations. We used Azure OpenAI Service with GPT-4, building a custom integration layer that translated natural language questions into KG queries and synthesized responses with EPA source attribution.

The Context AI microservice became the bridge between our KAG infrastructure and both OpenEPA (for emissions Q&A) and the energy sector AE dashboard. For OpenEPA, researchers could ask "Which Texas refineries increased emissions most from 2020-2023?" and get cited answers with EPA report URLs. For the AE dashboard, Context AI analyzed client KG data to generate company intelligence in under 60 seconds.

Deployment Details: Azure OpenAI Service (GPT-4 model), Azure Kubernetes Service for microservice orchestration, Redis for session caching, custom KAG integration layer for query translation. P95 latency: 2.1s for complex emissions queries. Scaled to support 100+ concurrent users with auto-scaling policies.

Calculation Editor: Industrial Workflows with Custom Ontology

Q1 2026 Calculation Infrastructure

Automated data is powerful, but we found an even bigger opportunity: enabling researchers to create industrial workflows using their own methodologies. I designed the Calculation Editor (Abacus) to let users build custom emissions intensity calculations (per MWh, per ton of product, per capita) with full formula transparency and methodology documentation.

The key was our custom ontology. Drawing on industrial best practices and client methodologies from energy companies, we designed an ontology that mapped EPA emissions data to production metrics, financial data, and operational parameters. Researchers could now normalize emissions by facility output and compare apples to apples, something EPA's raw data didn't support out of the box.

Technical Implementation: Custom ontology with 120+ industrial metrics, formula parser with validation and unit conversion, methodology documentation system with versioning, integration with OpenEPA benchmarking views and Context AI Q&A. Built with TypeScript, deployed as microservice with REST API. Researchers can export verifiable calculation certificates showing formula, methodology, and EPA source data, critical for academic reproducibility.

From Engineering-Led to Product-Led: Building the Amsterdam Team

Q2 2026 Launch & Team Evolution

As we prepared for OpenEPA's public launch, we formalized our team structure. We established an R&D office in Amsterdam with a small, focused team tracking work through a Kanban board and running bi-weekly retros. This wasn't just about process but about culture. We transitioned from an Engineering-led approach (build features, ship code) to Product-led (solve user problems, measure impact).

This transition actually started earlier with my work on the Immutably™ platform, where I shifted the company from feature-driven development to user-research-driven product strategy. With OpenEPA, Context AI, and Calculation Editor, we applied those same lessons: validate with users, ship MVPs fast, iterate based on feedback, and measure everything.

Launch Metrics: OpenEPA deployed with 99.9% availability SLA, P95 query latency at 2.1s (beating our 2.5s target), 100+ concurrent users supported, <24 hour data freshness from EPA. Context AI generated $85M in attributed pipeline. Calculation Editor enabled reproducible research with verifiable certificates for academic publications.

The result: three platforms—OpenEPA, Context AI, and Calculation Editor—working together to democratize access to industrial data and power data-driven decisions across energy, sustainability, and compliance sectors.

AI Automation Portfolio

Real-time dashboard showing AI automation impact across revenue generation, cost savings, and delivery acceleration

Pipeline Influenced $85M Energy sector deals
Annual Savings $270K 30% cost reduction
Time Reduction 50% 6 weeks saved
Issues Automated 1,200+ 85% reduction
Total Revenue Impact
$85M
Pipeline influenced through Context AI
Total Cost Savings
$270K
Annual savings (Infrastructure + Labor + Support)
Time-to-Market
50%
Faster delivery (12 weeks to 6 weeks)
AI Query Volume
150K/month
Across Context AI and EPA platforms
Automation Rate
85%
Issues resolved without human intervention
Model Accuracy
85%
Fine-tuned on 2,500+ energy sector docs
AE Efficiency Gain
95%
Time reduction (2+ hours → 5 minutes)

*Data based on internal Context Labs metrics (Q1 2025 - Q1 2026). Pipeline influence from AE attribution surveys (n=12 AEs). Cost savings vs baseline without AI automation.

Agile Transformation

Introduced agile product practices to Context Labs: sprint planning, iterative delivery, user feedback loops, and cross-functional collaboration. Transformed from ad-hoc feature development to systematic product delivery.

Agile Impact Metrics

Time to Market

Faster delivery
40%

Before: 12+ weeks average from ideation to production

After: 6 to 8 weeks for MVP, iterative enhancements every 2 weeks

User Satisfaction

+22 percentage points
87%

Before: 65% feature adoption rate (internal estimate)

After: 87% adoption for research-validated features

Engineering Efficiency

Reduction in rework
73%

Before: 30% rework due to unclear requirements

After: 8% rework with written PRDs and acceptance criteria

What I Learned From This Experience

Lead with User Research, Not Assumptions

Design research insights

AEs said "we need better client data" but ethnographic research revealed 2+ hours spent manually researching companies. Led design thinking workshops translating observed behaviors into design requirements—resulting in AI onboarding UX achieving 95% efficiency gain. Design leadership means uncovering user needs, not implementing feature requests.

Design Requirements Drive Technical Architecture

UX-first approach

Set OpenEPA user experience targets first (sub-2.5s query response, 99.9% availability), then technical architecture followed. For Context AI, designed interaction patterns requiring real-time state management, influencing choice of Pinia for Vue state. Design leadership means defining user experience goals that guide engineering decisions, not accepting technical constraints as given.

Design Prototyping Unblocks Engineering

3 weeks saved

Built high-fidelity interactive prototypes with realistic data for 4 energy clients before backend APIs existed. Design prototypes enabled parallel frontend development, stakeholder validation, and user testing—saving 3+ weeks per product cycle. Design leadership means creating design artifacts that serve as engineering specifications, not waiting for engineering to start.

Design for Trust Through Transparency

Design principle

Researchers won't use interfaces without data provenance. Every OpenEPA design pattern includes visible source attribution, version tracking, and methodology disclosure. Designed citation UX patterns enabling journalistic rigor and academic reproducibility. Design leadership for industrial data means designing transparency and trust as core UX principles, not optional features.

Building Enterprise AI Platforms with Agile Practices

I turn ambiguous problems into shipped products through user research, Azure AI deployments, and agile transformation. If you're building industrial data platforms, energy infrastructure systems, or AI-powered analytics, let's connect.